TenzorGEO supports your exploration and development activities with passive geophysical survey services for all water depths and onshore environments. We perform surveys of the subsurface from small pools to established fields in order to reduce risk, enhance ROI and facilitate well planning and design.
We have expertise using Low Frequency Seismic (LFS) across a large range of operations and industries including oil & gas operations, such as waterflooding and well location optimisation, and carbon storage in monitoring CO2 injection/fluid behaviour and fracture mapping.
A good understanding of the subsurface and related fluids is integral to ensuring the cost efficiency and environmental safety across an entire suite of operations. At TenzorGEO we strive to ensure that the subsurface is observed in the best way possible to suit the individuality of the project and at significant saving to the customer.
What is LFS?
LFS or Low Frequency Seismic is most commonly used as a DHI (Direct Hydrocarbon Indicator) geophysical methodology. It is a proven and robust means of identifying the spatial and volumetric characteristics of hydrocarbon or CO2 deposits in the subsurface. LFS has already been applied extensively to different geological and geographical situations, wherein the success ratio in solving tasks of hydrocarbon prospecting and exploration is over 85%.
To date over 126 projects are completed with a total researched area of 1133.5 sq. km. Notably, in 95 wells utilising the LFS method, 81 wells confirmed the anticipated forecast with 28 wells producing commercial hydrocarbons from the carbonate reservoirs, and 35 wells producing from terrigenous reservoirs.
Watch the “Webinar part 2: LFS principles, methods and application“
Application
The LFS technology is used to solve a wide range of geological and technological problems across a variety of operations. The technology is easily applied, cost effective and environmentally friendly across a spectra of operations from the onshore to offshore domain.
The method can be applied in prospecting, surveying and delineating the presence of hydrocarbons, optimising exploration targets and in production drilling. TenzorGEO have also leveraged on its high precision imaging capacity to offer a means of surveying CO2 plumes in subsurface storage operations.
LFS offers flexibility where conventional practices would not be an option for example due to block size, active seismic waves, energy penetration issues, budget limitations, accessibility and/or environmental restrictions.
Areas of application:
CO2 Subsurface Storage
Assessment of the geometry and position of the CO2 plume within the storage reservoir.
Identification of possible technogenic accumulations of CO2 in the overlying sediments.
Hydrocarbon delineation
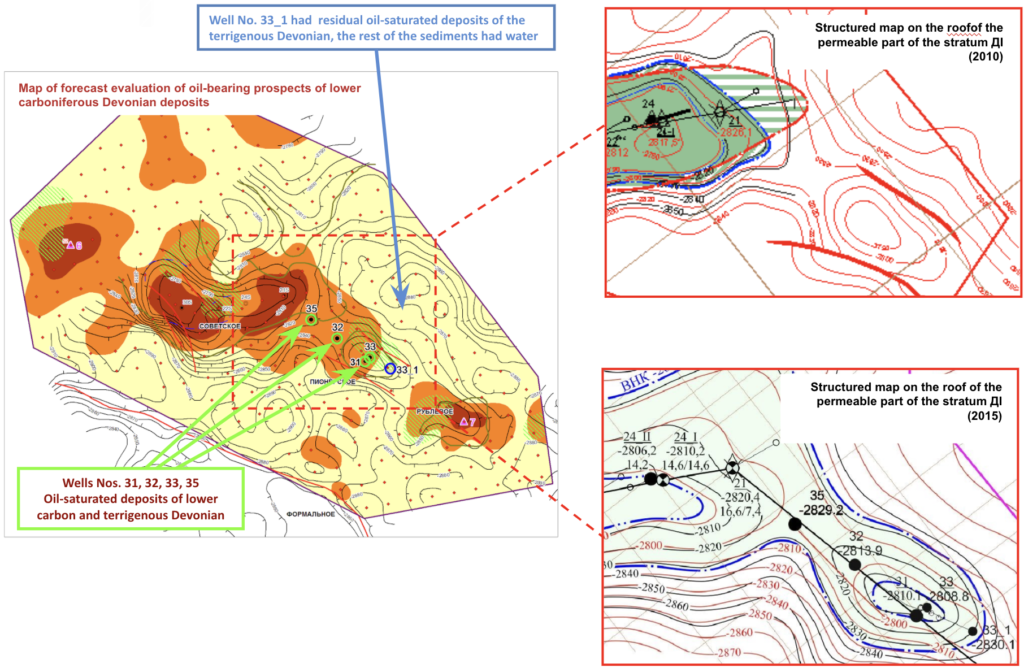
LFS can be deployed to identify hydrocarbon-bearing prospects. Correlation, structural and hydrocarbon deposit prospect maps can be produced to show the areas identified with highest hydrocarbon potential.
Well Location Optimisation
Optimising well location by identifying hydrocarbon volumes and subsequently where best to place well.
Physical Theory
LFS is a passive seismic method that utilises abnormal low-frequency seismic reflection from hydrocarbon deposits or fluids such as CO2 which possess similar spectral properties. LFS is based on analysing the spectral properties of low-frequency P- waves in the range of 0.5 – 10 Hz. The waves are derived from passive or naturally occurring seismic signals, which are modified in the presence of oil and gas deposits.
The occurrence of anomalous reflection from hydrocarbon deposits is associated with significant differences in the physical properties of hydrocarbons and water, such as compressibility, absorption, as well as due to the multiphase nature of the medium in the reservoir strata. Due to the mechanics of fluid-saturated, fractured and porous media, oil and gas reservoirs have high dispersion of velocity and high attenuation at low frequencies. A thin layer of oil/gas reservoir is characterised by high attenuation that reflects low-frequency P-waves, for this reason, it transforms the Amplitude-Frequency Characteristic of the media into an observational point in which TenzorGEO’s highly sensitive equipment can identify. This makes it possible to identify oil and gas deposits using observations from the surface by highly sensitive low-frequency equipment and the appropriate processing and interpretation software.
The effect of spectral differences within hydrocarbons has been proven and traced in various regions the world over within a variety of geological and geophysical settings.
Data Processing
Preparatory stage
The preparatory stage includes assessment of the field data quality by means of visual analysis of the spectra and dynamic spectrograms of seismic signals. In case of poor data quality, the onboard field crew shall carry out re-acquisition of the rejected receiver point. This stage also includes adjustment of automatic filtering techniques for individual features of the microseismic signals in the current survey area.
Generation of the final Fourier spectra
During this stage the final fourier spectra is generated to determine the origin of final signal recorded by the sensors. The signal that the sensor detects is one which is composed of many smaller original ‘noises’. It is important that the final signal is distinguished to separate the significant number of signals which make it up, thus allowing the identification of the original sources of each of these signals. This method allows for the identification of desired targets such as hydrocarbons.
Narrowband noise filtering
Narrowband filtering of noise is carried out using the optimisation method of quasiharmonic noise filtering with preservation of the background noise level in order to exclude the narrowband components caused by the monochromatic vibrations of the near-surface industrial sources. This allows for the identification of the frequency ranges where the desired signal events are unaffected by significant noises.
Spectral anomaly parameters estimation
Spectral anomaly parameter estimation can be described as calculations of spectral anomaly’s frequency, anomaly bandwidth and local signal-to-noise ratio) is carried out in an automatic mode using the algorithm of parameterization of the spectral peaks, which was developed based on the optimization of local peaks of the wavelet image of microseismic signal spectrum.
Transient noise filtering
Transient noise filtering is carried out in order to exclude the snapshot waveforms of the increased energy caused by the influence of the contaminating surface noise, which significantly distorts the spectrum of the desired background microseismic noise. This ensures the data that is received at the sensors and thereafter interpreted by the specialist team is of the highest accuracy and reliability.
Correction for spectral anomaly parameter variations
Repeated studies of the microseismic wavefield spectra have shown that there are variations in the anomaly parameters which are evident while comparing cumulative spectra recorded, for example, during the day and night. The technology enables the user to take into account the changes of anomalous parameters given the limited number of simultaneously observed points that are used under the conditions of temporal non-stability and spatial heterogeneity of the microseismic wavefield.
Interpretation
Would like to expand on each of the bullet points. Interpretation of low-frequency seismic sensing includes:
- Analysis of anomaly’s stability during the day
Stability of the anomaly during the day is studied here using the method of recording the temporal variations of the anomaly’s “signal-to-noise” parameter. - Typification of spectra
Nothing on the website – needs expanding. - Cluster analysis
Cluster analysis of the parameters of spectral anomalies (frequency, width and “quality” of an anomaly), which enables to:
1. visually assess the distribution of parameter values that form the cluster
2. separate stable spectral anomalies over the survey area from random ones
3. automate the generation of the physical fields of the values of anomalies’ parameters
4. numerically compare the parameters of anomalies recorded on different territories - Calculation of predicted frequencies
Calculation of predicted frequencies is carried out in accordance with the results of cluster analysis based on the well-velocity survey and VSP data on the distribution of longitudinal velocities in the section. As a result of comparison of the actual anomaly frequency with the set of predicted frequencies attributed to stratigraphic horizons, possible intervals of oil pool occurrence in the section is determined. - Comparative Analysis
Comparative analysis of the acquired spectra with the spectra from the territories with proven oil bearing capacity as per deep drilling data. - Numerical modeling
Numerical modeling of the seismic waves’ distribution in the geological environment is carried out in order to calculate the synthetic spectra of the microseismic vibrations assuming both absence of the oil saturation in the section and the presence of oil saturation in one or more target horizons. Acquired synthetic seismograms are compared with the field data which allows determining the most probable type of hydrocarbon accumulations in the section. - Mapping
Mapping and comparative analysis of the spatial distribution of anomalies’ parameters for evaluation of oil potential of the objects in question. - Numerical Simulation
The process of wave propagation in geological environments is influenced not only by the hydrocarbon deposits, but many other contrasting geological objects as well, which display results similar to that of the oil and gas pools. TenzorGEO utilises numerical modeling to study the behavior of microseismic events in complex geological environments.
Given the available seismic survey data of the area, a seismic-mechanical model of the geologic section is compiled which is then subjected to the numerical experiments on the microseismic waves distribution. Synthetic seismic gathers are calculated assuming both absence of the oil saturation in the section and the presence of oil saturation in one or more target horizons.
Acquired synthetic gathers are compared to field data using different statistical techniques which allows determination of the most likely option available and location of hydrocarbon accumulations.
Numerical modeling is performed on a high-performance computer based on the TESLA processor coupled with CUDA 2.1 programming environment from nVidia. Application of these solutions allows calculating multi-variant models of the geological environment in resolutions of up to 1m in 2D version and up to 10m in 3D. Calculations are carried out 30-200 times faster as when compared to the single-core 3GHZ Intel processor.
Software
The processing of low-frequency passive seismic data is characterised by the extremely large volume of raw data as well as by the need to subject said data to multi-variant resource-intensive calculations. For this purpose we apply an in-house software package based on the most advanced software and hardware solutions currently available.
The software package is built on three-level architecture. All resource-intensive calculations are installed within the application server and implemented on the basis of J2EE technology. The application server actively uses distributed calculations ensuring high scalability of the software package.
In order to ensure flexibility, the PC system manages the data processing according to a user-defined processing sequence. The processing sequence is compiled by the user from a significant number of standard processing functions and may be extended by the user-defined Java and Matlab modules. Processing sequence may include branchpoints and savepoints for intermediate results, thus making it possible to minimize repeated calculations.
Raw, intermediate and resulting data are stored in the relational database. The relational database has a flexible structure which may be expanded by the user. Along with the low-frequency seismic data, the system may also incorporate seismic data, well logging data and other factual / cartographic geological-geophysical information.
All available information may be graphically visualized at any stage of processing. Visualization includes plots, maps and 3D models. The content and the form of data presentation may be dynamically modified by the user during the course of data processing.
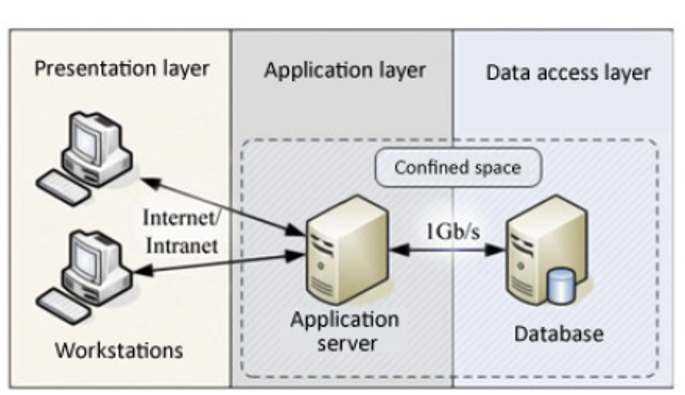
Visual representation of the three-level software package architecture. Application layer is where all intensive calculations take place. Separately, the data access layer is the core database encompassing the recorded seismic data. This setup allows for the computing intensivity to be reduced significantly.
Advantages of LFS
- Provides important information to operators regarding the Identification of non-structural deposit types.
- Allows for surveys to be conducted in regions that may be physically difficult to access.
- The method is highly efficient, for example, assuming a survey area of 30 sq.km with 300-400 observation points, processing can be complete in only two months (i.e. 1 month for data acquisition and 1 month for processing and interpretation).
- Environmentally friendly, unlike other seismic methods, LFS does not require a noise source such as explosions. Furthermore there is not a need for infrastructure such as wells and drilling equipment or even the use of chemicals as seen elsewhere.
Cases
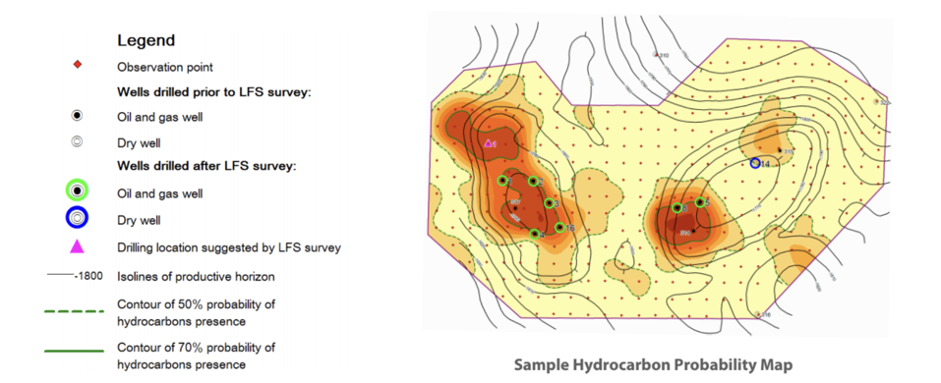
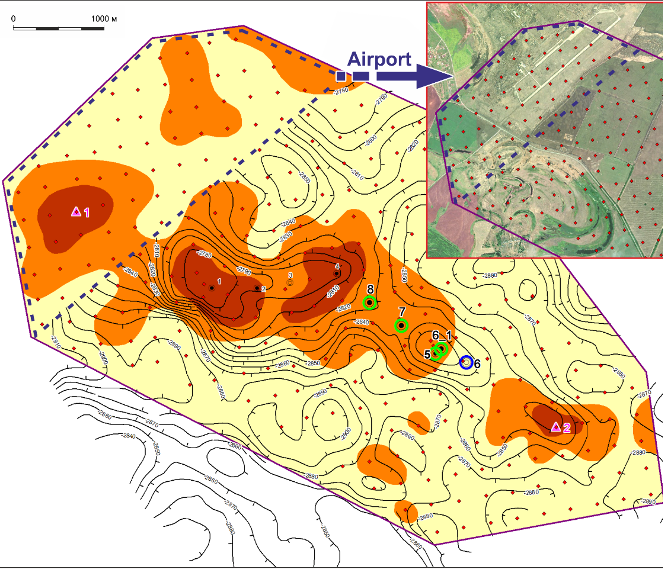
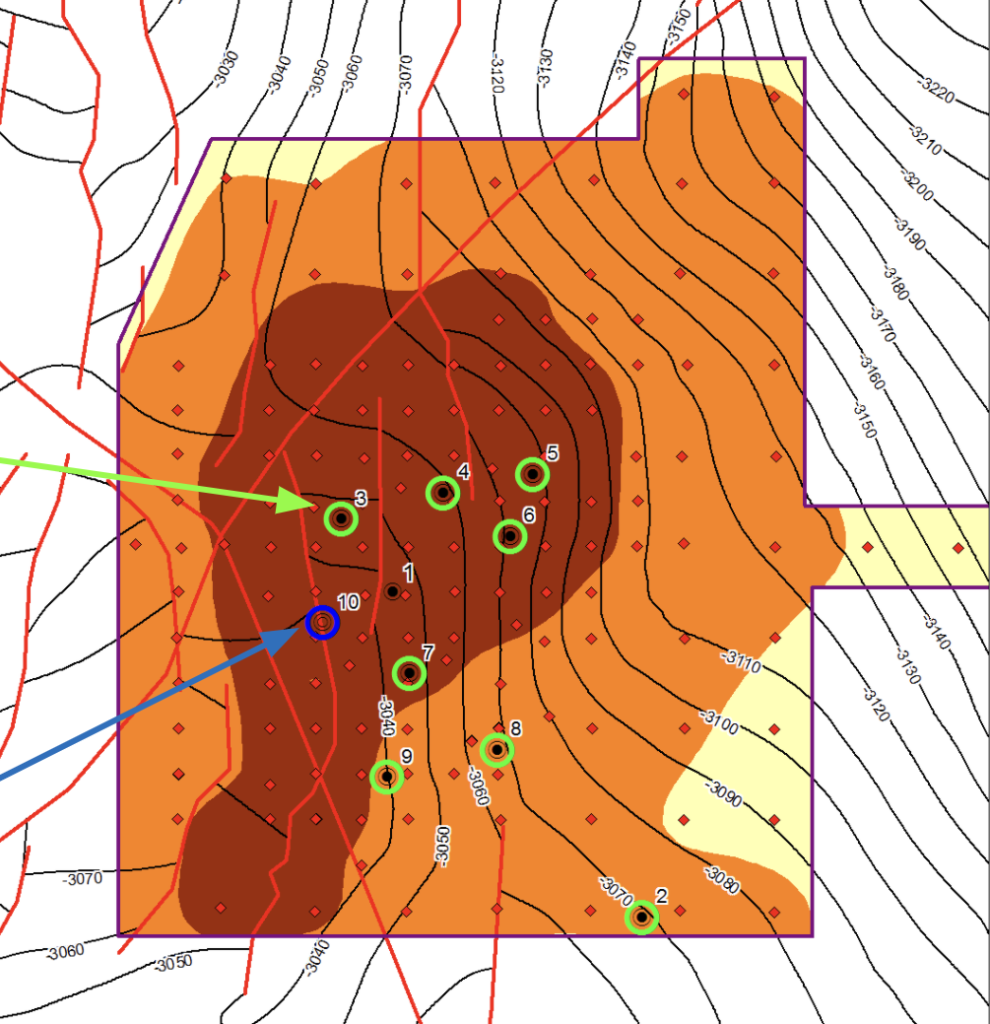
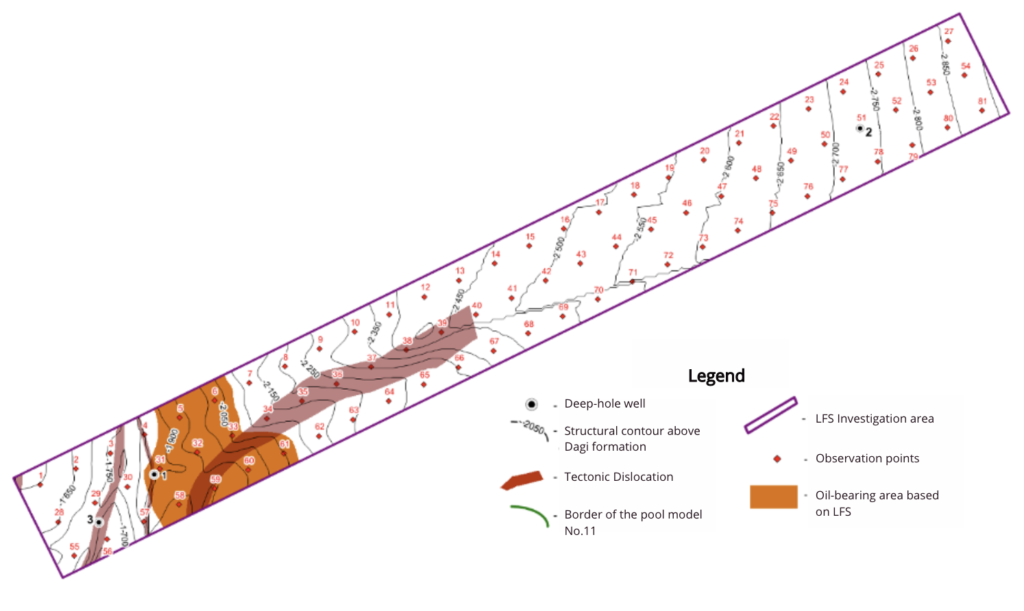
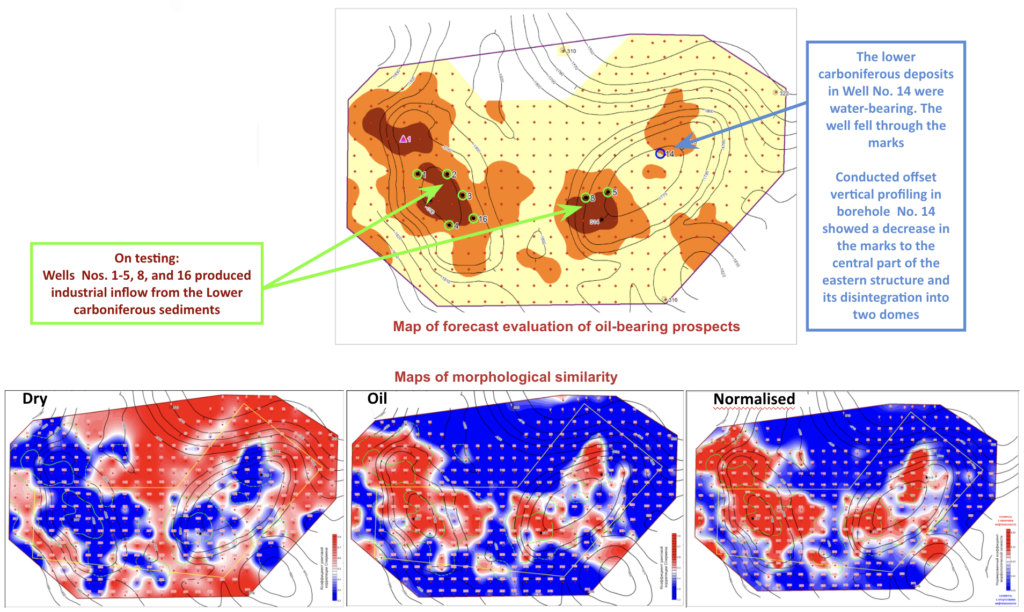
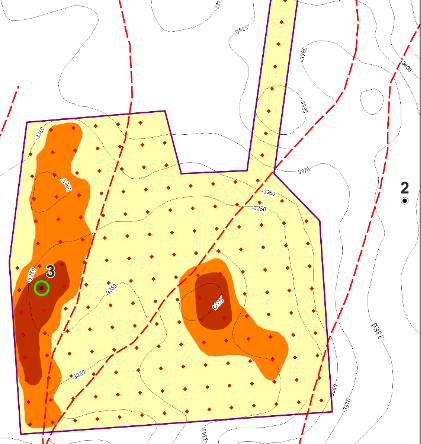
The map shows an evaluation of oil bearing prospects. Red dots present observation points (sensor location) used during the study. The identified oil bearing zones can be seen in orange, supporting the clients drilling location plans. Furthermore, areas of 50% and 70% commercial hydrocarbon presence probability are identified and reported to the customer.
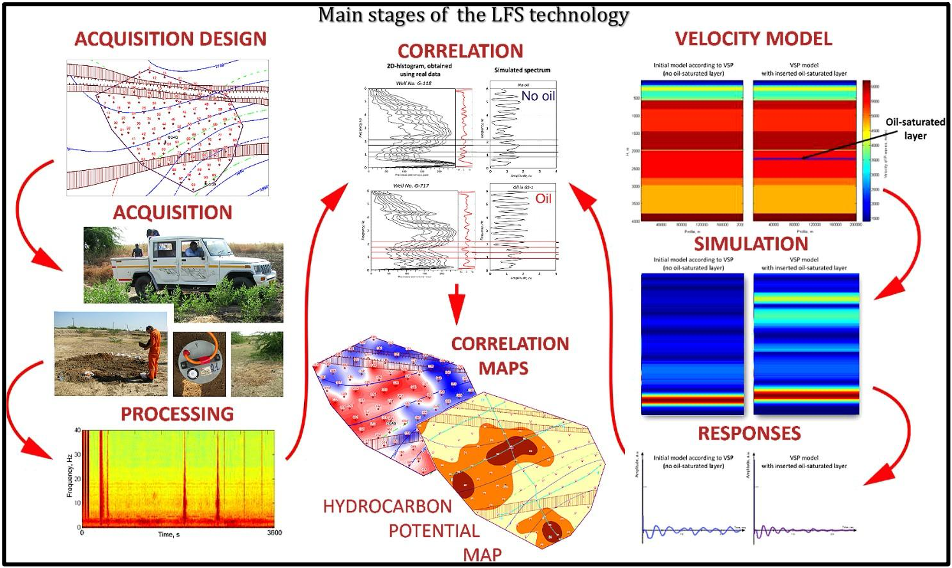
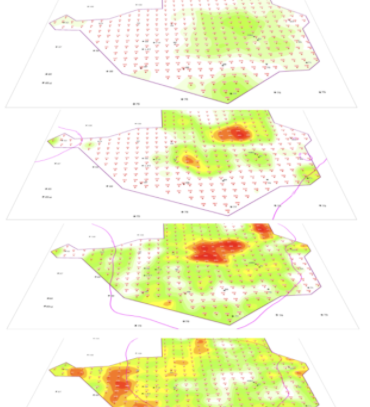
The image above shows an overview of the various stages involved during an LFS study. This includes the field work design and acquisition on the left, the production of simulated models based on the properties of the area on the right, and finally the results produced using correlation shown in the middle, leading to the ginal hydrocarbon potential maps provided to the client.